

Interpreting and Visualizing Regression Models Using Stata
Interpreting and Visualizing Regression Models Using Stata
Paperback
Couldn't load pickup availability
Join our rewards scheme and earn reward points on this purchase!
Earn points on this!
Sign in or Sign up!- Release Date: 18/12/2020
- Barcode: 9781597183215
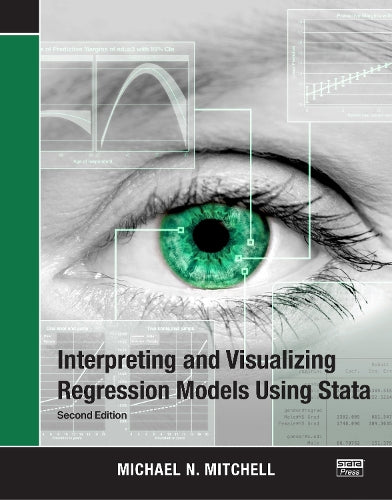

Interpreting and Visualizing Regression Models Using Stata
Couldn't load pickup availability
Collapsible content
DESCRIPTION
This book provides clear and simple examples illustrating how to interpret and visualize a wide variety of regression models. If you ever find yourself wishing for simple and straightforward advice about how to interpret and visualize regression models using Stata, this book is for you. Interpreting and Visualizing Regression Models Using Stata, Second Edition provides clear and simple examples illustrating how to interpret and visualize a wide variety of regression models. Including over 200 figures, the book illustrates linear models with continuous predictors (modeled linearly, using polynomials, and piecewise), interactions of continuous predictors, categorical predictors, interactions of categorical predictors, and interactions of continuous and categorical predictors. The book also illustrates how to interpret and visualize results from multilevel models, models where time is a continuous predictor, models with time as a categorical predictor, nonlinear models (such as logistic or ordinal logistic regression), and models involving complex survey data. The examples illustrate the use of the margins, marginsplot, contrast, and pwcompare commands. This new edition reflects new and enhanced features added to Stata, most importantly the ability to label statistical output using value labels associated with factor variables. As a result, output regarding marital status is labeled using intuitive labels like Married and Unmarried instead of using numeric values such as 1 and 2. All the statistical output in this new edition capitalizes on this new feature, emphasizing the interpretation of results based on variables labeled using intuitive value labels. Additionally, this second edition illustrates other new features, such as using transparency in graphics to more clearly visualize overlapping confidence intervals and using small sample-size estimation with mixed models. If you ever find yourself wishing for simple and straightforward advice about how to interpret and visualize regression models using Stata, this book is for you.
DELIVERY & RETURNS
UK Delivery:
- Free delivery on all orders of £10 or more.
- £1.49 delivery fee on orders below £10.
- UK orders are shipped via Royal Mail 2nd Class.
International Delivery:
- Flat rate delivery charges vary by country.
Dispatch and Delivery Times:
- All orders are shipped from our warehouse in Northampton, UK within 48 hours of receipt during working hours.
- UK mainland orders typically arrive within 3-5 working days via Royal Mail 2nd Class.
- International estimated delivery times:
- Europe & Channel Islands: 7 to 10 working days
- USA: 7 to 15 working days
- Rest of the World: 9 to 21 working days
View our full delivery infomation here.
-
OVER
2 MILLION PRODUCTS
-
60 MILLION CUSTOMERS
ACROSS 190 COUNTRIES
You might also like
Loading recommendations...